-
US 500 cash index experiences a minor pullack
-
Meets support at 123.6% Fibo extension of its 2022 downtrend
-
Oscillators exit overbought zones, but do not weaken dramatically

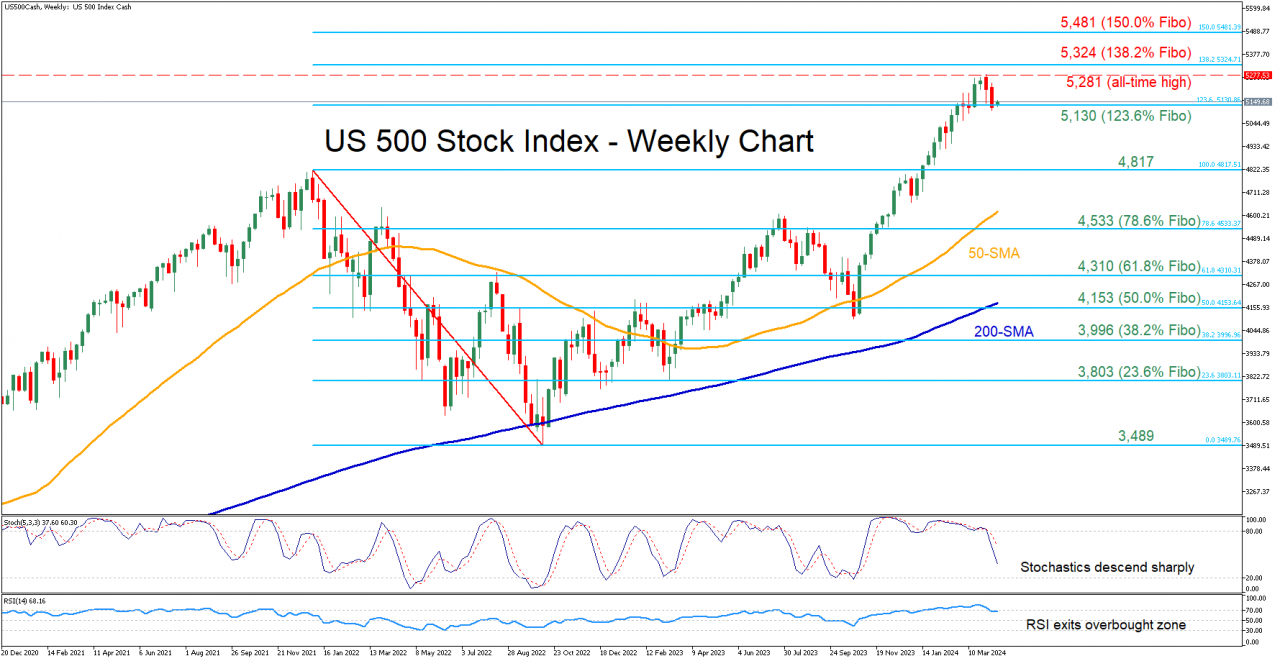
The US 500 stock index (cash) has been staging an impressive rally since it bottomed out in October 2023, generating consecutive all-time highs. Although the price has been experiencing a setback in the past two weeks, it’s still too early to call for a sustained downside correction.
Should bearish pressures persist, the index could challenge 5,130, which is the 123.6% Fibonacci extension of the 4,817-3,489 downtrend. Slicing through that hurdle, the price may descend towards the 2021 peak of 4,817, which could serve as support in the future. Even lower, the 78.6% Fibo of 4,533 could provide downside protection.
In case the bulls regain the upper hand, the recent record high of 5,281 could come under scrutiny. Further advances could then cease around the 138.2% Fibo of 5,324. A break above that zone could pave the way for the 150.0% Fibo of 5,481, which lies very close to the 4,500 psychological zone.
Overall, the US 500 index has been facing some downside pressures in the near-term as its advance had gotten extremely overstretched. Is this a temporary pullback or the start of a strong downside correction?